Clio’s 2025 benchmarks put the average law firm at 38% utilisation, 88% realisation and 93% collection.[1] Read one at a time, none of those figures sounds alarming. Most partners would accept 88% of recorded work reaching an invoice, and most would be pleased to collect 93% of what they bill.
The trouble is that the three rates are not independent scores. Each one applies to whatever survived the stage before it. Multiply them together and the picture changes: of an eight-hour day, about 2.5 hours end up as cash.
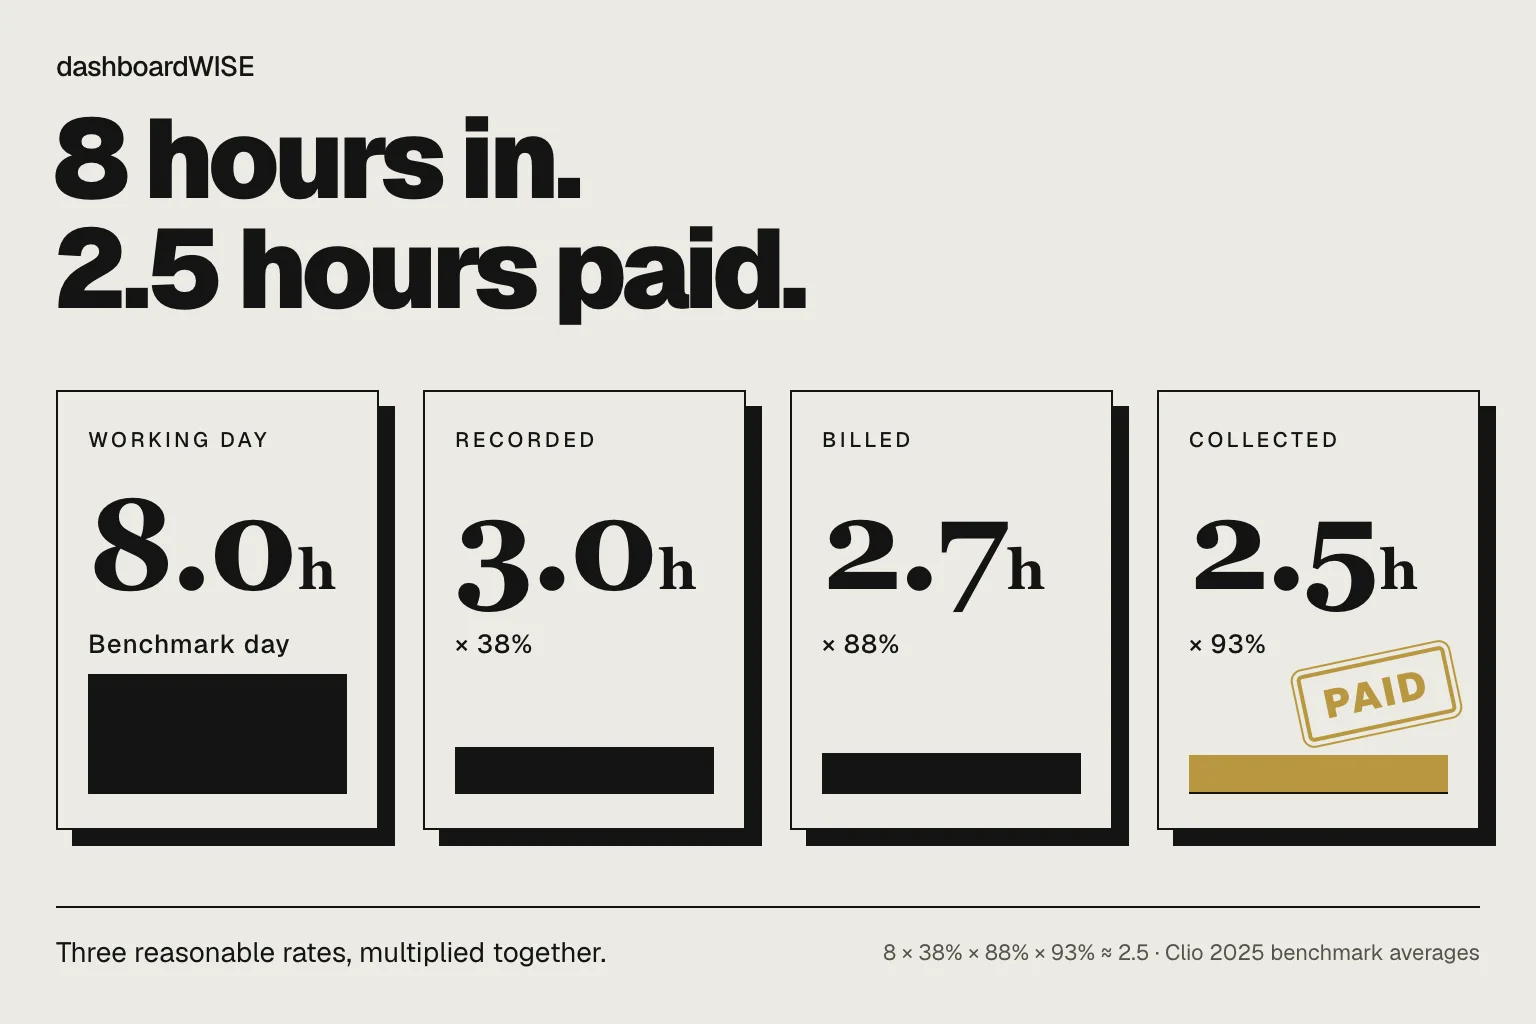
Three rates, one chain
Clio defines the three rates in sequence. Utilisation is the share of an eight-hour day recorded as billable work. Realisation is the share of that billable work invoiced to clients. Collection is the share of invoiced work that gets paid. Each denominator is the previous stage’s output, which is why the rates multiply rather than average.
8 × 0.38 × 0.88 × 0.93 ≈ 2.49 hours. This is a rough illustration rather than a measured result. The three averages come from different populations of firms, and multiplying averages does not give the exact average of the product. Treat it as an order of magnitude.
Two further caveats matter. The eight-hour day is Clio’s reporting convention, not a claim that lawyers work eight hours. And unrecorded time is not wasted time: business development, supervision, training and administration are all real work. The point is not that fee earners are idle. It is that only a small share of the day carries the firm’s revenue, so small changes in any link have outsized effects.
Why multiplication changes the conversation
Because the stages multiply, an improvement in one link lifts everything after it. The table below changes one rate at a time, keeping the others at the benchmark average.
These scenarios are illustrative, not customer results.
None of these changes involves raising a rate or winning a new client. Thirty minutes of better time capture is worth more, in collected hours, than moving realisation from 88% to 93%. That does not make utilisation the right place to start for every firm. It is often the hardest link to move, and pushing billable targets without fixing how time is captured tends to produce padded entries that are written off later. But it does mean the weakest link deserves attention before anyone debates rates.
Find your weakest link in ten minutes
You can rebuild the chain for your own firm from figures your practice management system already holds. In Clio Manage or Smokeball, pull three numbers for the last full quarter:
- Billable hours recorded, and the value of that time at standard rates.
- The value of time billed on invoices issued in the period.
- Professional-fee cash received in the period.
Divide recorded hours by the number of fee earners and working days to get recorded hours per fee earner per day. Divide billed value by recorded value for an approximate realisation rate, and cash received by billed value for an approximate collection rate.
Use a quarter rather than a month. Work recorded in August may be billed in September and paid in October, so a single month’s figures often describe different matters. A longer window smooths most of that timing, although it does not remove it entirely. We covered the timing problem in detail in Reading a law firm’s collection funnel.
Then compare each link with the benchmark, and with your own previous quarter. The link furthest below either reference is where to start.
If recording is the weak link
Well under three recorded hours per fee earner per day usually points to time capture rather than workload. Time reconstructed at the end of the day or week is reliably lower than time recorded as the work happens. Short tasks such as calls, emails and quick reviews are the first to disappear.
- Compare recorded hours by fee earner. A wide spread between people doing similar work suggests a recording habit, not a demand problem.
- Look at the days of the week. A drop on Fridays, or a spike on the last day of the month, suggests reconstruction.
- Check non-billable categories. Work that could be charged is sometimes recorded as non-billable by default.
If billing is the weak link
A realisation rate well below 88% usually traces back to how work is scoped and priced, rather than to the invoice itself. Write-downs at the pre-bill stage are where an unrealistic estimate, an unclear fee agreement or work outside the original scope finally becomes visible.
- Rank last quarter’s write-downs by matter type and by responsible partner. They tend to cluster.
- Check unbilled work older than 60 days. Time that sits unbilled becomes harder to bill in full.
- For fixed-fee work, compare the fee with the value of time recorded. Realisation means something different there, but the comparison still shows which matter types are priced too low.
If collecting is the weak link
Collection problems are usually about process rather than clients. An ageing report separates invoices that are still within terms from those that are overdue; Clio’s aged-receivables report, for example, measures each balance against the bill’s due date.[3]
- Total the invoices more than 90 days overdue. That figure, more than the collection rate, shows what is genuinely at risk.
- Agree who follows up, and when: a reminder at seven days overdue costs less than a conversation at ninety.
- Review payment terms and payment methods. Online card and bank payments shorten the time between invoice and cash.
Use benchmarks as context, not targets
Clio’s figures come from aggregated, anonymised data from paid U.S. subscribers.[2] They are a useful reference point, but not a universal target and not a UK benchmark. Practice area matters too: a conveyancing practice on fixed fees and a litigation practice billing hourly will produce very different chains, both for good reasons.
Definitions also vary between systems. Before comparing your rates with anyone else’s, check what each one uses as its numerator and denominator, and which dates decide the period. The most reliable comparison is usually your own firm, quarter on quarter, measured the same way each time.
What to take to the next partners’ meeting
Bring one figure for each link, the link furthest below its reference point, and one specific action for it, with a named owner and a review date. Then measure the same three figures again next quarter.
dashboardWISE connects read-only to Clio Manage and Smokeball and shows each link in the chain for the whole firm, by fee earner and by matter, so the weakest link is visible without rebuilding the calculation each quarter.
References and further reading
- Clio, “Law Firm KPIs: Key Performance Indicators & Benchmarks”, 2025 benchmarks. Average utilisation, realisation and collection rates, and their definitions. Accessed 26 October 2026.
- Clio, 2025 Legal Trends Report, Appendices A and B. KPI definitions and research methodology. Accessed 26 October 2026.
- Clio, “Clio Manage Billing Reports”. Receivables, WIP and due-date ageing. Accessed 26 October 2026.